PLANNING PHASE ACTIVITY in the U.S. hotel pipeline continued to rise in 2023, while the number of rooms in construction decreased following two months of gains, according to CoStar. Meanwhile, the U.S. hotel industry achieved its highest ADR and RevPAR on record in 2023. Furthermore, the country’s occupancy level reached its peak since 2019, with the top 25 markets demonstrating higher occupancy and ADR than all other markets.
U.S. hotel pipeline in 2023
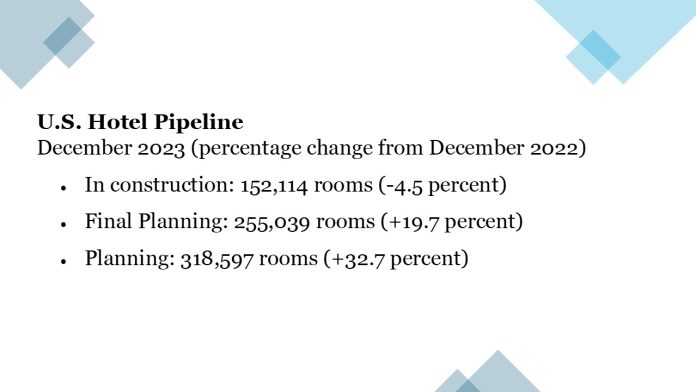
Around 152,114 rooms were under construction in 2023, marking a 4.5 percent decrease from 2022, CoStar said. Final planning saw approximately 255,039 rooms, reflecting an 19.7 percent increase from the previous year. In the planning stage, there were approximately 318,597 rooms, a 32.7 percent increase from 2022.
“The decline in the number of rooms under construction in December follows a nearly 7 percent increase in October, which remained steady through November,” said Isaac Collazo, STR’s vice president of analytics. “Throughout much of 2023, the number of rooms in construction lagged behind 2022 figures. However, the notable increases in both the final planning and planning stages signal confidence in travel for the foreseeable future. It is noteworthy that historically, the final phase of the pipeline has exhibited a month-over-month decline in December.”
Meanwhile, upper midscale and upscale projects maintain pipeline dominance, comprising more than half of the in-construction room count. In the existing supply, the luxury segment accounts for 4.7 percent, representing approximately 6,631 rooms. Upper upscale follows with 2.7 percent of the existing supply, comprising a total of 19,112 rooms. The upscale segment contributes 3.9 percent to the existing supply, encompassing 34,457 rooms.
In the upper midscale category, the supply stands at 3.5 percent, with a room count of 42,467. The midscale segment has a 2.5 percent share of the existing supply, featuring 12,455 rooms. Lastly, the economy segment holds a 1.2 percent share of the existing supply, with a room count of 7,837.
Dallas leads the top five U.S. hotel construction markets in the third quarter, setting a record with 189 projects and 21,840 rooms, according to Lodging Econometrics. Following closely, Atlanta has 140 projects and 17,775 rooms, and Nashville ranks next with 122 projects and 16,046 rooms. Phoenix recorded 119 projects totaling 16,455 rooms, while the Inland Empire reported 117 projects comprising 11,784 rooms. All top markets experienced growth in new openings, the LE study revealed in October.
Occupancy peaks since 2019
Occupancy ended the year at 63 percent, marking a 0.6 percent increase from the previous year. ADR reached $155.62, a 4.3 percent rise from 2022, while RevPAR stood at $97.97, reflecting a 4.9 percent increase compared to the preceding year.
Among the top 25 markets, New York City led with the highest performance metrics in 2023: occupancy increased by 8.8 percent to 81.6 percent, ADR rose by 8.5percent to $301.22, and RevPAR surged by 18.1 percent to $245.77.
Meanwhile, STR and Tourism Economics’ 2024 U.S. hotel forecast anticipates a 0.1 percent growth in ADR, with occupancy and RevPAR maintaining stability. However, 2025 projections indicate a downward revision for key metrics, reflecting stabilized long-term trends: occupancy down by 0.1 percentage points, ADR decreasing by 0.3 points, and RevPAR declining by 0.5 ppts.


